logo
OCEAN  SCIENCE  EDUCATION
bridgelogo


What Will a Warmer, More Acidic Ocean Mean for American Lobsters? [StoryMap]

Virginia Sea Grant has created a ArcGIS StoryMap based on a research program looking at the impact of climate change on the physiology of the American Lobster. Content includes background information about ocean acidification, American lobster and the research intself. Embedded in this StoryMap you'll find six classroom activities created by two high school teachers interning in the research lab and focus on ocean bathymetry, ocean acidification, water quality, experimental design, lobster respiration and lobster life history.

Bridge DATA - Coral Snapshots

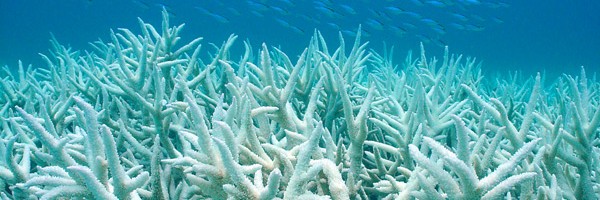
While it is possible to survey a coral reef using quadrats, scientists are now using technology to closely examine the entire reef; instead of extrapolating results from several study sites. Scientists at the Virginia Institute of Marine Science are taking video of reefs and then analyzing it via a computer program back in the lab. This method cuts down on the inherent error associated with the quadrat system and actually requires less time and money spent in the field.

The Bridge's own DATA Series is made up of lesson plans (DATA Tips) on many ocean science topics that explore the world of water using the language of science: mathematics. Learn more about the DATA Series.

Scripts