
DATA Series
The Oyster Calculator: How Much Nitrogen Can You Sequester?
- Lesson Time : 45 minutes
- Grade Level : 6-12
- Vocabulary: algae bloom, accumulation, aquaculture, decomposition, bioremediation, eutrophication, filter feeding, nitrogen
- Data Tool: Aquaculture Nutrient Removal Calculator (ANRC)


Celia Cackowski
Author
Subject Area
Fisheries & Aquaculture
Nutrient Pollution
Focus
Download PDF
Summary
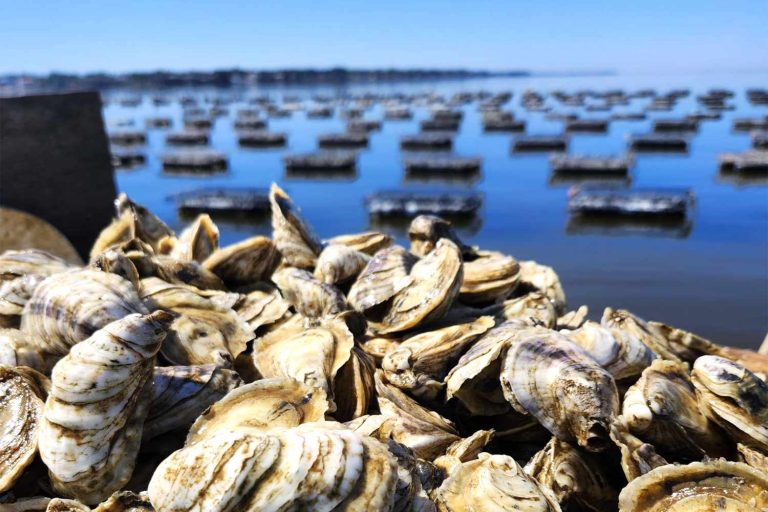
Working in groups, students will design a small-scale oyster farm and use NOAA’s online calculator to predict how much nitrogen their operation will remove from the surrounding water over a growing season. Using the resulting figures, students can then calculate nitrogen sequestering estimates for 10 and 20 years of operation, future farm expansion, etc. This lesson is appropriate for middle and high school biology, environmental science, marine science, and aquaculture classes.
Objectives
- Explain how oysters contribute to water quality improvement through nitrogen removal
- Analyze and compare data outputs from different farm designs
- Evaluate the potential role of aquaculture in addressing human impacts on coastal ecosystems.
- Use NOAA’s Aquaculture Nutrient Removal Calculator to estimate nitrogen removal by oyster farms.
- Analyze and compare data outputs from different farm designs.
- Evaluate the potential role of aquaculture in addressing human impacts on coastal ecosystem
Background Information
Nitrogen is a natural part of ecosystems, but too much can cause harmful algal blooms and dead zones. Oysters help balance nitrogen by filtering water, storing nitrogen in their shells and tissues, and stimulating denitrification in sediments. Restoration and aquaculture of oysters is one potential tool for reducing nitrogen and improving water quality in coastal systems. In this activity, students will design an imaginary oyster farm, input their farm details into NOAA’s online Oyster Calculator Tool, and compare how much nitrogen their farms remove from the water.
• The Problem: Coastal waters are often overloaded with nitrogen from fertilizers, wastewater, and stormwater runoff.
• The Oyster Solution: Each adult oyster can filter 30–50 gallons of water per day. While feeding, they remove particles containing nitrogen, storing it in their shells and tissues. Additionally, their waste helps fuel microbial processes that release nitrogen gas harmlessly back into the atmosphere.
• The Tool: NOAA’s ANRC allows users to estimate nitrogen removal by oyster aquaculture based on farm size, growing method, and harvest cycles.
Data Activity
Oysters remove nitrogen from water by filtering it and incorporating the nitrogen into their tissues and shells, a process called bioextraction. Oysters also indirectly promote nitrogen removal by creating reefs that enhance beneficial microbial processes, like denitrification, which converts reactive nitrogen into a harmless gas. After introducing the concepts of eutrophication to the class, have students brainstorm how oysters may help to solve the problem.
- Divide class into pairs or small groups.
- Print a copy of the worksheet for each group.
- Each group imagines they are starting an oyster farm. They must decide:
– Location Type: open bay, estuary, river mouth, etc.
– Farming Method: cages, bottom planting, floating bags
– Farm Size: total number of oysters
– Harvest Cycle: 1 year vs. multiple years
Using the NOAA Calculator
- Visit the Oyster Aquaculture Nutrient Removal Calculator Tool
- Teacher models how to enter data into the tool (screen share or demo):
– Select species (Eastern oyster)
– Input farm size and gear type
– Set harvest schedule
– Run the calculation - Each group enters their farm design and records outputs:
– Total nitrogen removed (per year).
– Nitrogen stored in shells vs. tissue.
– Long-term projections (10–20 years).
Graphing Your Results
Option A – Built-In Graphing Assignment
After students run their farm design through the ANRC tool, have them record nitrogen removal values and graph them manually.
– Plot time (years) on the x-axis vs. cumulative nitrogen removed (kg) on the y-axis.
– Groups can project out 1 year, 10 years, 20 years using their farm’s numbers.
– In discussion, compare slopes: which farms remove nitrogen faster? Why?
Option B – Whole-Class Comparison Graph
Teacher collects nitrogen removal outputs from all groups and either:
– Plots them on the board (bar chart: different groups on x-axis, nitrogen removed on y-axis), OR
– Has students enter results into a shared spreadsheet (Google Sheets/Excel auto-generates a bar or line graph).
This way students can visually compare different farm designs side by side.
Option C – Adding “What If” Graphs
Challenge students to change one variable (e.g., farm size or harvest cycle) and graph how nitrogen removal changes between scenarios.
– “Graph two scenarios: your original farm design vs. an expanded version (double the oysters).
– What does the graph tell you about the relationship between farm size and nitrogen removal?”
Oysters reduce nitrogen through three main pathways:
Filtration – Oysters filter large volumes of water, removing particulate and dissolved nitrogen compounds such as nitrate (NO₃⁻) and organic nitrogen.
Accumulation in tissues and shells – Nitrogen is assimilated into oyster biomass, which can be harvested or naturally remineralized.
Enhancing sediment denitrification – Oyster reefs trap organic matter and create habitats for microbes that convert nitrate into harmless nitrogen gas (N₂)