DATA Series
Pulse of the Pacific: Tracking ENSO
- Lesson Time : 60-90 minutes
- Grade Level : 9-12
- Vocabulary: El Niño Southern Oscillation (ENSO), El Niño, La Niña, sea surface temperature (SST), anomaly, Niño 3.4 region, Oceanic Niño Index (ONI), trade winds, upwelling, Southern Oscillation Index (SOI)


Summary
Every few years, conditions in the tropical Pacific Ocean shift dramatically. Sometimes surface waters become unusually warm; at other times, they become unusually cool. These changes are part of the El Niño Southern Oscillation, or ENSO, and they can affect marine ecosystems, fisheries, rainfall, drought, storms, and weather patterns thousands of miles.
Objectives
- Describe normal, El Niño, and La Niña conditions in the tropical Pacific Ocean.
- Explain relationship between trade winds, sea surface temperature, and coastal upwelling.
- Define a temperature anomaly and distinguish it from an actual temperature.
- Graph ENSO data over time.
- Use the ONI to identify periods of warmer- and cooler-than-average ocean conditions.
- Compare the duration and intensity of different ENSO events.
- Evaluate whether El Niño and La Niña occur at regular intervals.
- Use data as evidence to explain potential effects of ENSO on marine ecosystems.
The Pacific Ocean is enormous, covering nearly one-third of Earth’s surface. Changes in its temperature and circulation can therefore have consequences far beyond the Pacific itself.
Under typical conditions near the equator, trade winds blow from east to west across the tropical Pacific. These winds push warm surface water toward Indonesia and other parts of the western
Pacific. Near the west coast of South America, surface water moving away from the coast is replaced by colder water rising from below. This process, called upwelling, brings cold, nutrient-rich water into the sunlit surface ocean.
Those nutrients support the growth of phytoplankton, which form the base of a highly productive marine food web. As a result, the waters off western South America support important populations of fish, seabirds, and marine mammals, as well as some of the world’s largest commercial fisheries. But conditions do not always remain this way.
El Niño
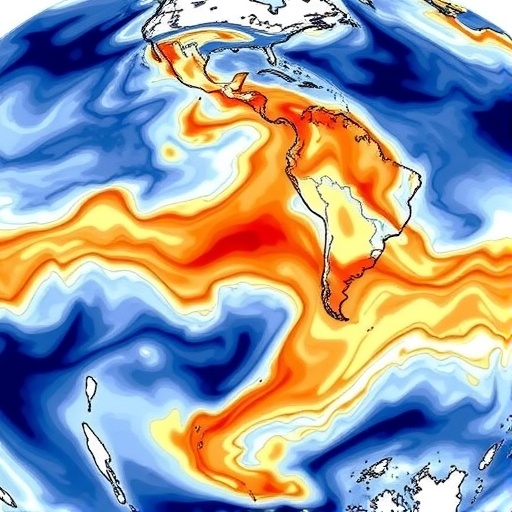
During an El Niño, the easterly trade winds weaken. Warm surface water spreads farther east across the equatorial Pacific and sea surface temperatures in the central and eastern Pacific become warmer than average.
As the warm surface layer deepens in the eastern Pacific, less cold, nutrient-rich water reaches the surface. Reduced upwelling can decrease phytoplankton productivity and affect organisms throughout the marine food web.
The effects do not stop at the ocean. Changes in the location of warm water also change where air rises, where rain falls, and how winds move through the atmosphere. These changes can alter weather patterns around the world.
La Niña
During La Niña, the normal Pacific pattern becomes stronger. Trade winds are generally stronger than average and push even more warm surface water toward the western Pacific.
Upwelling in the eastern Pacific increases, and sea surface temperatures in the central and eastern tropical Pacific become cooler than average.
Like El Niño, La Niña can change rainfall, temperature, and storm patterns in locations far from the tropical Pacific.
El Niño and La Niña are opposite phases of a larger ocean-atmosphere pattern known as the El Niño-Southern Oscillation, or ENSO. Between El Niño and La Niña events, conditions are considered ENSO-neutral.
ENSO events usually occur every few years, but does that mean they follow a regular cycle?
The data can help us find out.
Measuring ENSO
Scientists monitor temperatures, winds, atmospheric pressure, precipitation, and other conditions throughout the tropical Pacific using satellites, ships, drifting instruments, and ocean buoys.
One important area is the Niño 3.4 region, located along the equator in the central tropical Pacific. Scientists compare sea surface temperatures in this region with the long-term average.
The difference between an observed value and an average value is called an anomaly.
For example:
- A sea surface temperature anomaly of +1.2°C means the water was 1.2°C warmer than average.
- An anomaly of –0.8°C means the water was 0.8°C cooler than average.
- An anomaly near 0°C indicates conditions close to average.
One commonly used historical measurement of ENSO is the Oceanic Niño Index, or ONI. The ONI uses a running three-month average of sea surface temperature anomalies in the Niño 3.4 region.
Historically, sustained ONI values of approximately +0.5°C or higher have been associated with El Niño conditions, while sustained values of –0.5°C or lower have been associated with La Niña conditions. Values between these thresholds generally represent ENSO-neutral ocean temperatures.
Scientists also examine the atmosphere before declaring an ENSO event because ENSO is not simply an ocean temperature change, it is a coupled ocean-atmosphere phenomenon.
The ENSO dataset contains monthly climate observations beginning in 1950. For the core activity, students will use the following variables:
- Date
- Year
- Three-month season
- Oceanic Niño Index (ONI)
- Niño 3.4 sea surface temperature anomaly
- ENSO phase
Graph the Pacific Pulse
Open the ENSO dataset in Microsoft Excel, Google Sheets, or another spreadsheet program.
Create a line graph showing ONI over time.
Place:
- Date or three-month season on the X-axis
- ONI (°C) on the Y-axis
Give the graph an appropriate title, such as:
Oceanic Niño Index, 1950–Present
If possible, add horizontal reference lines at: +0.5°C, 0°C, and –0.5°C
The +0.5°C and –0.5°C lines will help you identify periods of warmer- and cooler-than-average conditions.
Note: A blank graph is provided on the following page. If you would like your student to practice setting up a graph from scratch, please feel free to have them create their own. After plotting the data, students will use the attached worksheets to analyze their graph and answer questions.
Using the ENSO dataset, complete a line graph:
Bridge DATA Series ENSO Blank Graph
Use your graph to answer the questions on the following worksheets:
For more information on ENSO and other global weather patterns, visit:
NOAA NCEI – El Niño/El Niño Southern Oscillation (ENSO)